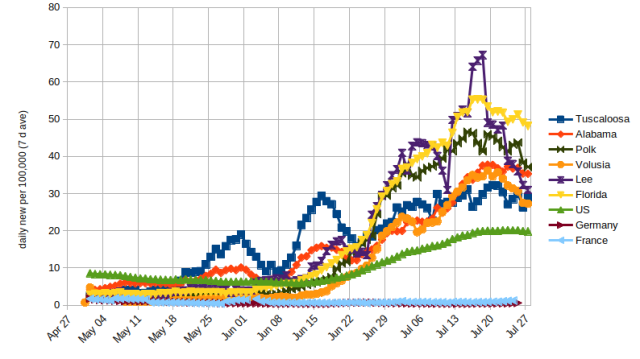
Here is a plot of history since the end of April. New cases per day per 100k population. Shown are states and counties where I have family. Data is as recorded by me each evening from the
Alabama public health dashboard and from the
Florida "community" dashboard, and from Wikipedia articles for the
United States,
Germany, and
France. France and Germany are between 0.5 and 1 almost the whole time. That is what successful test-and-trace looks like. Slow, sporadic spread from contained local outbreaks.